Unreal Debugging
#5As a large and mature engine, Unreal provides a suite of debugging systems and tools to aid development, which go hand-in-hand with your standard C++ debugger. This page aims to give an incomplete and mostly unordered whirlwind tour of some of the more useful tools I’ve run across while working in Unreal. If I’ve missed anything big or particularly useful, I’d love to hear about it!
Note that most of my experience thus far has been in UE versions 4.27 and
5.0, although I believe the majority of the tools mentioned here work just as
well for more recent versions of the engine.
It’s also worth mentioning that I’m omitting some very significant tools in this list, like Unreal’s stats system and Unreal Insights, which can be useful when debugging resource usage or performance – but that starts to delve into the realm of profiling and optimization, so I’ll save that for a future post.
Console #
As anyone who’s used Unreal for any length of time will attest, Unreal’s console is quite powerful, and has lots of functionality that other tips in this article use.
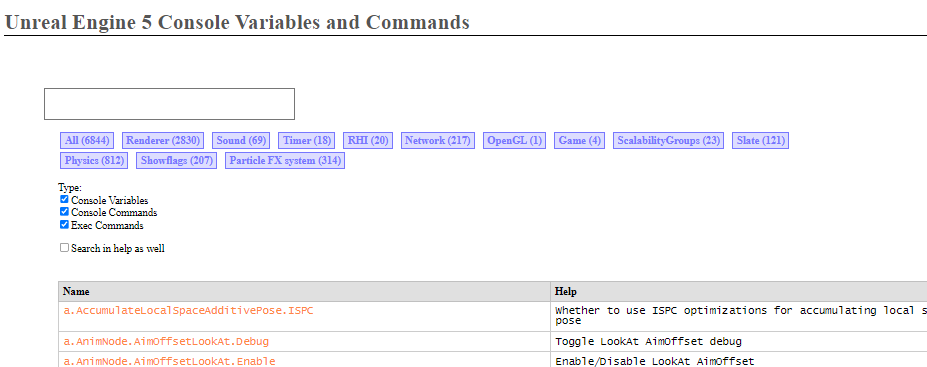
One somewhat hidden feature is that Unreal provides a nice web UI that lists out all console variables and commands, which can be launched by (appropriately) running the console command:
help
Build configurations #
To start, we have to build and launch the editor. :) Unreal projects come with several build configurations. When C++ debug symbols aren’t sufficiently available while stepping through code, you can try to use a more debugger-friendly mode.
Development- A good default, but comes with tons of optimizations, making debugging difficult.DebugGame- Some optimizations are turned off for the game project, but not the engine.Debug- Most debugger friendly, but costly to compile when building from source.
Disabling optimization #
It can often be more convenient to disable optimizations for a specific piece of
code instead of for your entire project. You can disable optimizations in a
module directly in Unreal Build Tool by modifying the corresponding
.Build.cs file and adding:
OptimizeCode = CodeOptimization.Never;
Alternatively, to disable just a single file or code section, you can use the
following pragma (use the prefix PRAGMA_ instead of UE_ if using <5.2):
UE_DISABLE_OPTIMIZATION

// ...

UE_ENABLE_OPTIMIZATION
This is equivalent to the non-Unreal code:
#pragma optimize("", off)

// ...

#pragma optimize("", on)
Logging #
Somewhat obviously, the classic UE_LOG is still a good way to debug.
UE_LOG(LogTemp, Log, TEXT("My debug message"));
Starting with UE 5.2, you can also use the new UE_LOGFMT macro to easily
interpolate values into the message.
#include "Logging/StructuredLog.h"

UE_LOGFMT(LogTemp, Log, "Pokemon box {Box} has {Num} 'mons!", BoxId,  BoxContent.Num());
If you need to flush output more readily (e.g. because of a crash), you can pass
a flag to the editor: -ForceLogFlush.
To switch verbosity levels in the editor, run the following (the category name must be the full name, including “Log” if it’s part of the name as per convention):
Log LogMyCategory Verbose
On-Screen Messages #
You can add on-screen debug messages for just-in-time information. Akin to
Blueprint’s Print.
GEngine->AddOnScreenDebugMessage(
	-1, /*TimeToDisplay*/5.0f, FColor::Green, FString::Printf(TEXT("Info: %d"), info));
Visual Logger #
Unreal has a Visual Logger component that is designed to help you log events and debug shape information over time. It’s a whole tool with lots of different ways to use it, and the Visual Logger documentation has a lot of info on how to get started.
Gameplay Debugger #
Somewhat akin to but separate from the Visual Logger, the Gameplay Debugger Tool (GDT) provides a powerful way to watch real-time data for a game. The official Gameplay Debugger docs have a lot more info.
DrawDebug #
An immediate-mode debug drawing API. There are lots of functions and options to
choose from, and this comes in very handy when working in 3D and trying to
understand what’s happening (I’m looking at you, FRotator).
#include "DrawDebugHelpers.h"

// There are lots of DrawDebug* functions!
DrawDebugSphere(GetWorld(), /*Center=*/FVector(100.0, 200.0, 300.0), /*Radius=*/500.0f,
				/*Segments=*/32, FColor::Red);
Debug Camera #
Unreal has a debug camera that will constantly shoot out a ray at the center of
the screen and give you debug info about what is being hit. Toggle with the ;
key or the command:
ToggleDebugCamera
ShowDebug #
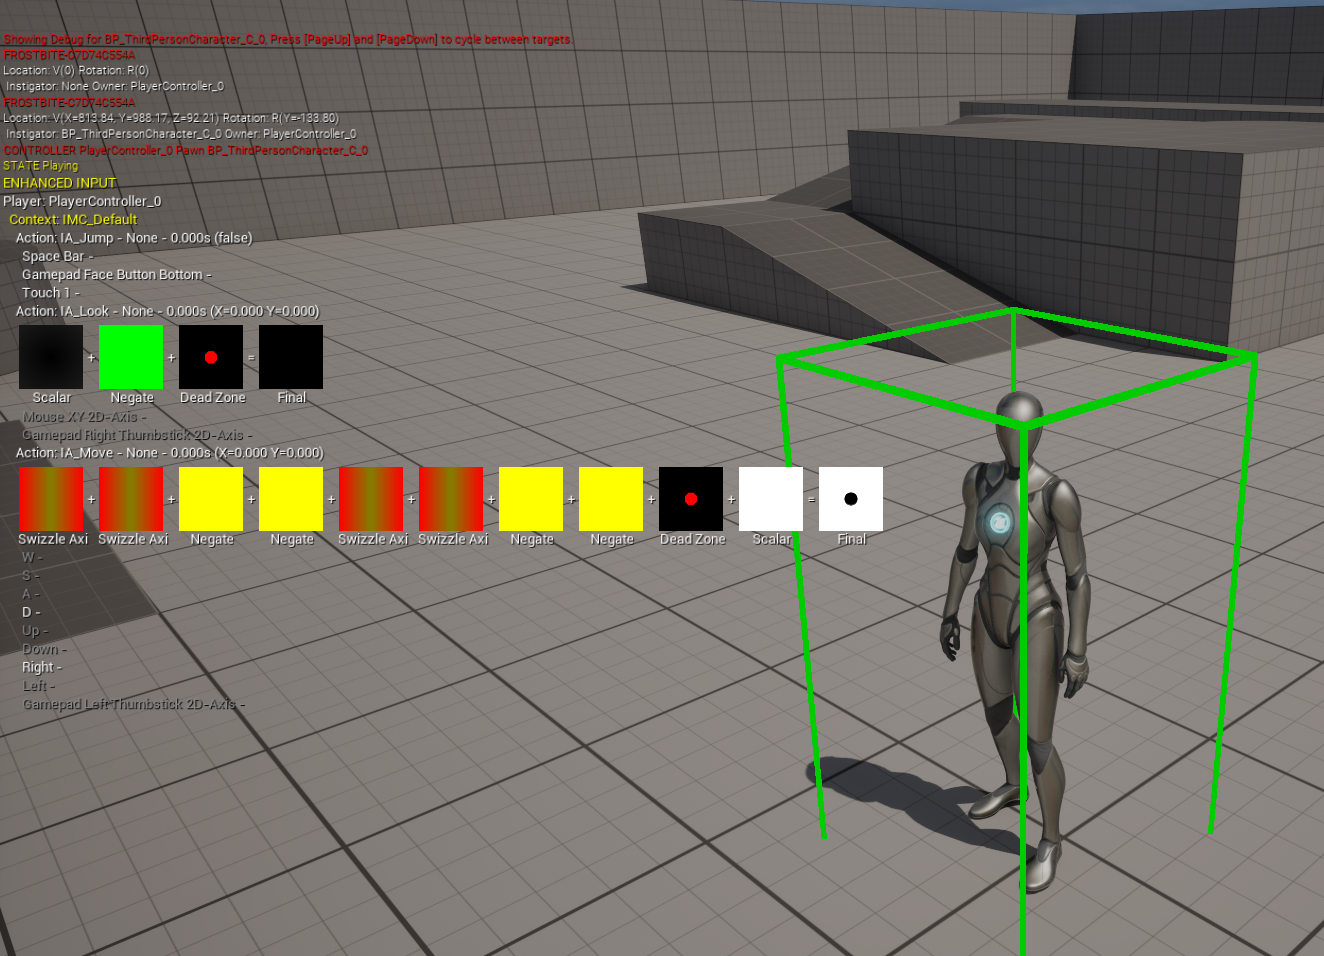
Several Unreal systems can display real-time debug information on screen, which
can be activated by a ShowDebug console command. The console’s autocomplete
can list the categories!
ShowDebug EnhancedInput
Memory corruption #
Memory corruption issues can be difficult to debug. While Unreal ostensibly has support for tools like AddressSanitizer, I haven’t been able to get it working.
However, Unreal provides a -stompmalloc flag which changes the allocator to
one which tries to better detect and report memory issues – this has proven to
be indispensible when working on low-level, memory-manipulating code.
Another potentially useful flag is -ansimalloc which uses the default C
allocator instead of Unreal’s own default.
Garbage collection #
Some memory issues may arise due to Unreal’s garbage collection mechanism. To debug more easily, you can use the following console command to force a GC every frame:
gc.CollectGarbageEveryFrame 1
RHI issues #
You may run into some issues that are related to a specific Rendering Hardware Interface (RHI), and sometimes the default RHI of your dev machine may not match your target machine or console. To force a specific RHI, you can pass the relevant flag if your system supports it:
-d3d12-d3d11-vulkan-opengl
In addition, for D3D and Vulkan, you can pass -d3ddebug or -vulkandebug
(respectively) to get more detailed logs.
Blueprints #
Passing the command line -ScriptStackOnWarnings when launching the editor
prints a stack trace upon Blueprint warnings, useful for locating tricky issues.
Rendering and game thread #
There are several console commands that give you control over rendering behavior.
To toggle rendering, allowing you to inspect the viewport (useful for debugging culling techniques):
freezerendering
To pause the game thread:
pause
To change tick rate to 50%:
slomo 0.5
GPU passes #
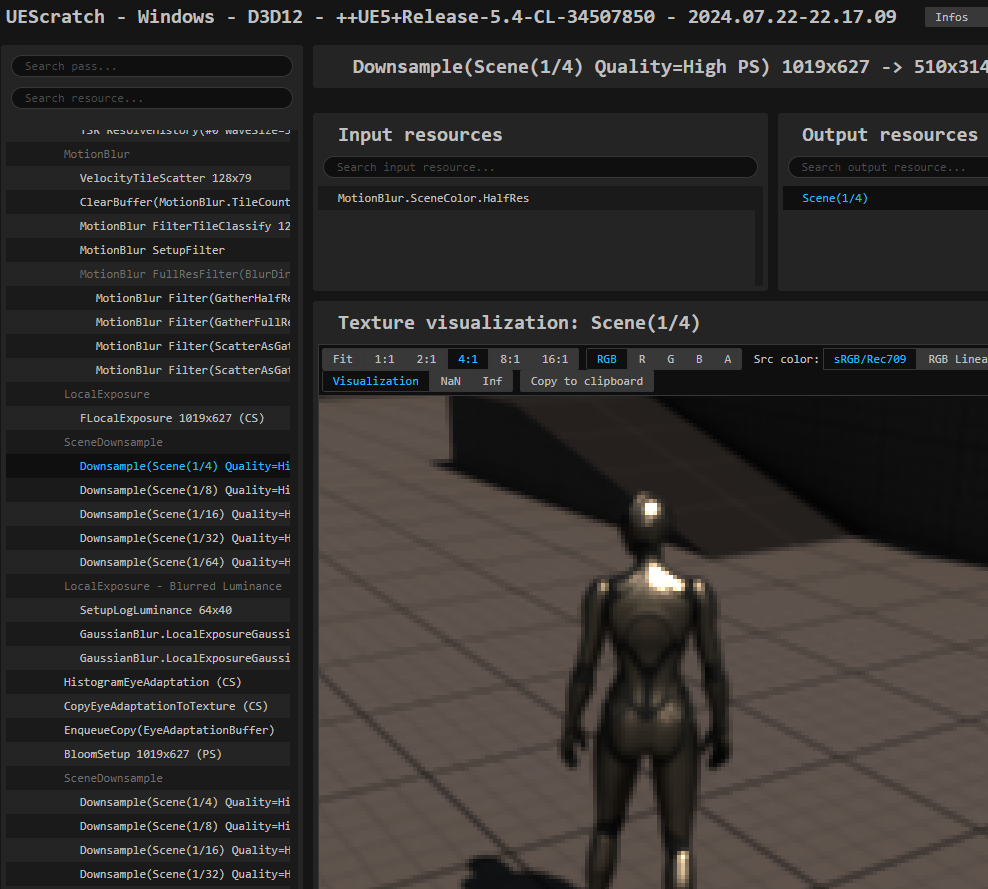
To debug Unreal’s GPU render passes, you can dump info on a single frame and analyze it.
DumpGPU
This will generate a set of files under Saved/GPUDumps with a viewer .html
page and launcher scripts, which you can use to view the trace.
RenderDoc #
Unreal has first class support for the wonderful RenderDoc graphics debugger, although it requires a bit of set up.
After setting it up, you can capture frames several ways, including using console commands.
To set the number of frames to capture:
renderdoc.CaptureFrameCount 5
To immediately capture a frame:
renderdoc.CaptureFrame